Excel - print charts in black and white
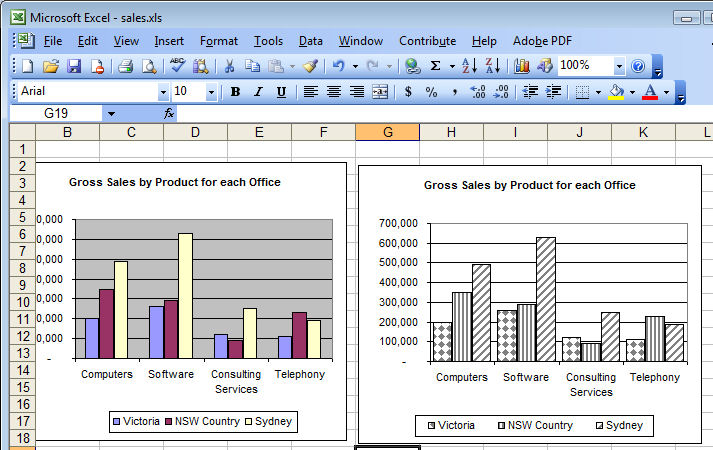
Although your Excel chart might look great in color on the screen, if you're printing to black and white or printing in color and planning to reproduce the charts in black and white you might be disappointed with the final result. Light green, light blue and light orange all look very different on the screen but are indistinguishable in black and white.
So, when your chart is destined for reproduction in black and white, set it up so it is guaranteed to be readible. To do this, select each series or data point by clicking on it, right click and choose Format Data Series (or Format Data Point)> Patterns tab > Fill Effects > Pattern and use a grey or a black and white pattern. Repeat for all the series and save before printing. The chart is guaranteed to look good when printed.
Labels: black and white, chart, Excel 2003
posted by Jane @ 3:59 PM
![]()
![]()


3 Comments:
That works great in excel 2003, but there is no pattern tab in excel 2007? how can I do the same without stugling with textures that dont fit nicely?
I was struggling with this in 2007 as well... You could try the 'Chart Style' section - it has a variety of colour schemes, one of which is a black/white/grey scale scheme which gives reasonable contrast and ordering for black and white printing...
This is advice for Excel 2003, but I also can find any advice for Excel 2007.
Post a Comment
Please feel free to add your comment here. Thank you!
Subscribe to Post Comments [Atom]
<< Home